


Let’s take a look at Bitcoin Price Prediction and technical movement. The price of bitcoin is creeping on Friday, extending losses from the previous two days. BTC is projected to fall further to retest critical support levels, as bulls are unwilling or unable to maintain a position over $45,000. Bitcoin (BTC) is in a long-term downtrend that has been validated across numerous time frames. Today’s price movement is no exception. Every time the price began to rise, sellers entered the picture, causing the asset to record lower lows.
Bitcoin Price Prediction
BTC/USD may attempt the horizontal $36,000 barrier if it creates a daily candlestick below the psychological $40,000. Let’s have a look at some technical indicators to get a sense of the impending price action:
RSI: The daily Relative Strength Index has established lower lows, reflecting to the price’s steady decline.
MACD: The Moving Average Convergence Divergence (MACD) is attempting to trade above the midline but is having difficulty establishing a foothold in positive territory.
PVT: The Price Volume Trend Indicator (PVT) reports on variations in the asset’s demand and supply. As prices approach the supply zone, volume decreases.
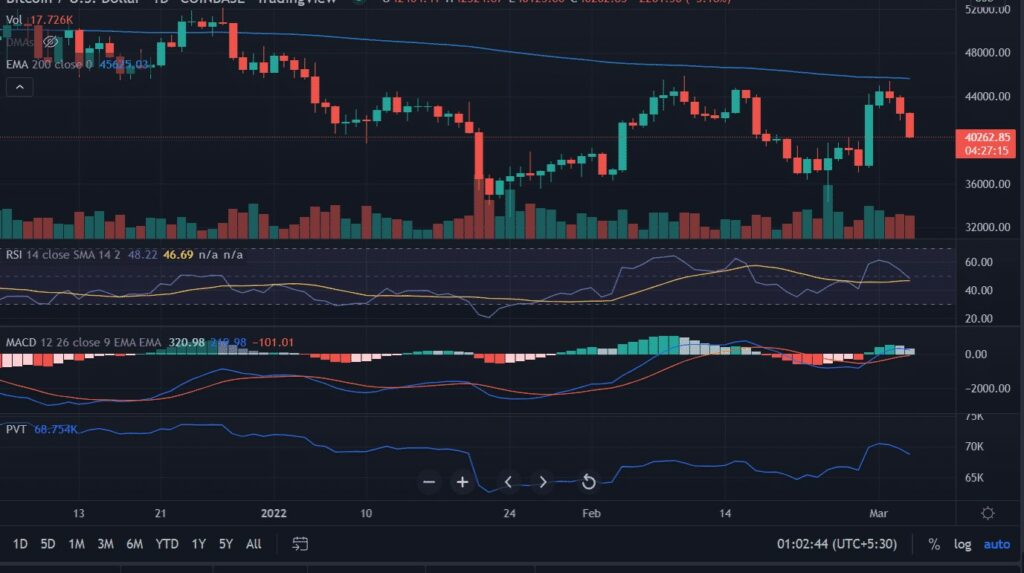
Alternatively, if investors maintain the critical $40,000 level on a daily closing basis, bulls will try to retest the March 3 high of $45,426.45. Buyers would gain $50,000 if acceptance rose above the 200-day Exponential Moving Average (EMA).
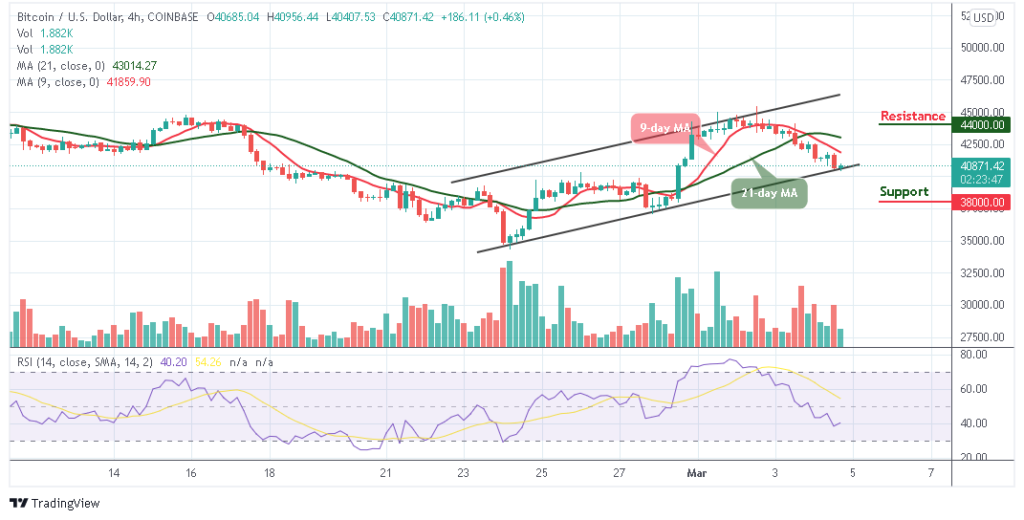
Furthermore, if buyers can recover from the present support level of $40,832, the first level of resistance may be found at $43,000. Above this, $45,000 is expected to provide additional resistance. This is likely to be followed by resistance at $48,000, $50,000, and $52,000. As a result, if the currency is able to break above these levels, the market may be on the verge of turning bullish in the long run. At the moment, the Relative Strength Index (14) is anticipated to go below the 40-level, indicating that further bearish indications are likely to emerge.
Furthermore, if buyers can recover from the present support level of $40,832, the first level of resistance may be found at $43,000. Above this, $45,000 is expected to provide additional resistance. This is likely to be followed by resistance at $48,000, $50,000, and $52,000. As a result, if the currency is able to break above these levels, the market may be on the verge of turning bullish in the long run. At the moment, the Relative Strength Index (14) is anticipated to go below the 40-level, indicating that further bearish indications are likely to emerge.
[wpdiscuz-feedback id=”s32ej1l49a” question=”Please leave a feedback on this” opened=”0″][/wpdiscuz-feedback]