


Bitcoin’s price began a rapid rise above $45,000 against the US dollar. BTC is currently encountering resistance near $50,000, but it may continue to rise.
Bitcoin increased its momentum above the $45,500 and $47,500 resistance levels.
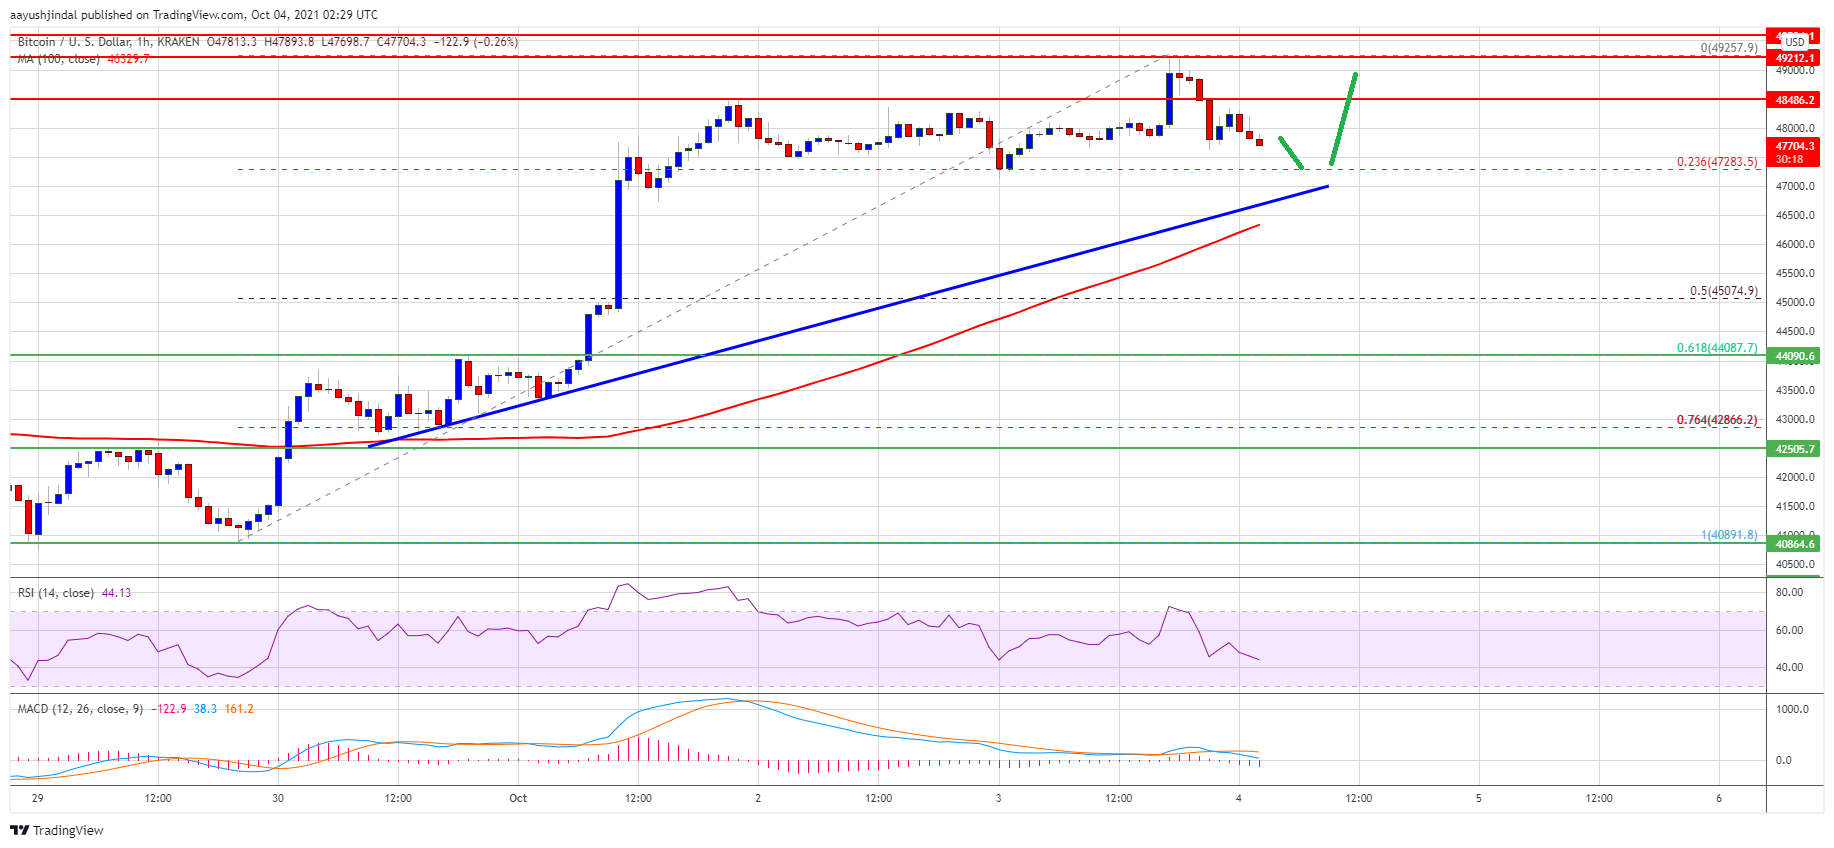
The price is currently trading above $47,000 and above the 100 hourly simple moving average.
On the hourly chart of the BTC/USD pair, a key bullish trend line is forming with support near $47,000. (data feed from Kraken).
The pair may correct lower, but the bulls are likely to remain active near $47,000 or $46,500.
Bitcoin Price Gains Pace
Bitcoin’s price began to rise sharply above the $45k resistance level. BTC has broken through the $46,500 resistance level and is now trading above the 100 hourly simple moving average. Bitcoin turns green why BTC may soon exceed $ 50k.
The bulls gained traction, and the price surged above the $47,500 resistance level. It even broke the $48,800 barrier and reached a high of $49,257. It is currently correcting lower and trading under $48,500. On the downside, there is immediate support near the $47,500 level.
Bitcoin is now trading well above the 23.6 percent Fib retracement level of the recent rally from a swing low of $40,890 to a high of $49,257. On the hourly chart of the BTC/USD pair, a key bullish trend line is forming with support near $47,000.
On the upside, an immediate resistance level is near $48,000. The first major resistance is near $48,500, above which the price may return to $49,250.
The next major stumbling block is around $50,000. A close above $50,000 could trigger a significant increase in the near term. In the aforementioned scenario, the price could rise to $52,000 in the near future.
Dips Supported In BTC?
If bitcoin fails to break through the $48,500 resistance level, it may begin a new downward trend. On the downside, there is immediate support near the $47,500 level. Bitcoin turns green why BTC may soon exceed $ 50k. Near the $47,250 level and the channel trend line, the first major support is now forming.
A break below the trend line support could push the price down to $46,500. The 100 hourly simple moving average is also close to $46,500, providing support. The next major support level, at $45,075, could be near the 50 percent Fib retracement level of the recent rally from the $40,890 swing low to the $49,257 high.
Technical indicators:
Hourly MACD – The MACD is now losing pace in the bullish zone.
Hourly RSI (Relative Strength Index) – The RSI for BTC/USD is now just below the 50 level.
Major Support Levels – $47,250, followed by $46,500.
Major Resistance Levels – $48,500, $49,250 and $50,000.
Source: NEWSBTC