
Fantom, also known as its native token FTM, has recently been working wonders in the cryptocurrency market. Check out the overview before we begin with a comprehensive Fantom price prediction.
Before the start of the new year, Fantom Price provided former investors with a massively profitable return on their chart trading. Fantom (FTM) now has a market valuation of $7,268,948,119 and a supply in circulation of 2,545,006,273 FTM. Fantom FTM had a $1,052,908,880.68 24-hour trading volume, and its price is now hovering around $2.8.
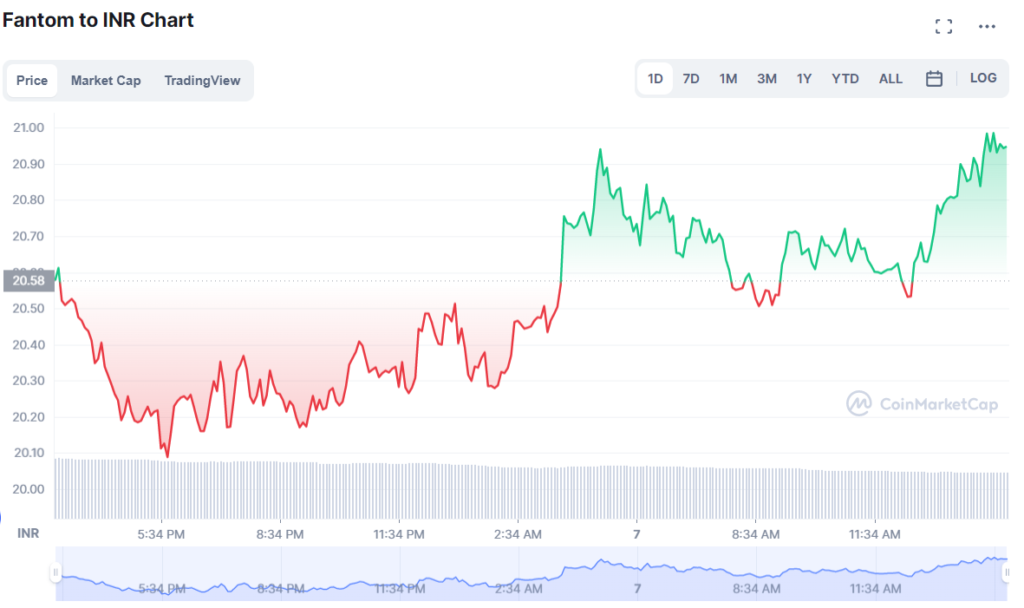
FTM Price in INR
Fantom Price Today in India is ₹ 20.96 with a 24-hour trading volume of ₹11,71,11,85,656. In the last 24 hours, FTM-INR price has increased by 1.9%. Fantom CoinMarketCap rank is 71. The circulation supply of Fantom is 2,54,11,52,731.01FTM coins, with maximum circulating supply being unlimited.
Share your thoughts on the latest FTM price prediction.
Latest news on FTM in India July 2022
Short-selling Fantom traders may set their stop-loss over this threshold.
Recently, Bitcoin dropped below the $20k threshold. The inability of the bulls to defend the $20k and $20.8k levels demonstrated that the cryptocurrency market was still experiencing significant amounts of panic.
Fantom hinted to a bullish break two days ago as it moved to $0.25. This movement was not maintained, and as of the time of publication, the bias appeared to return to being bearish.
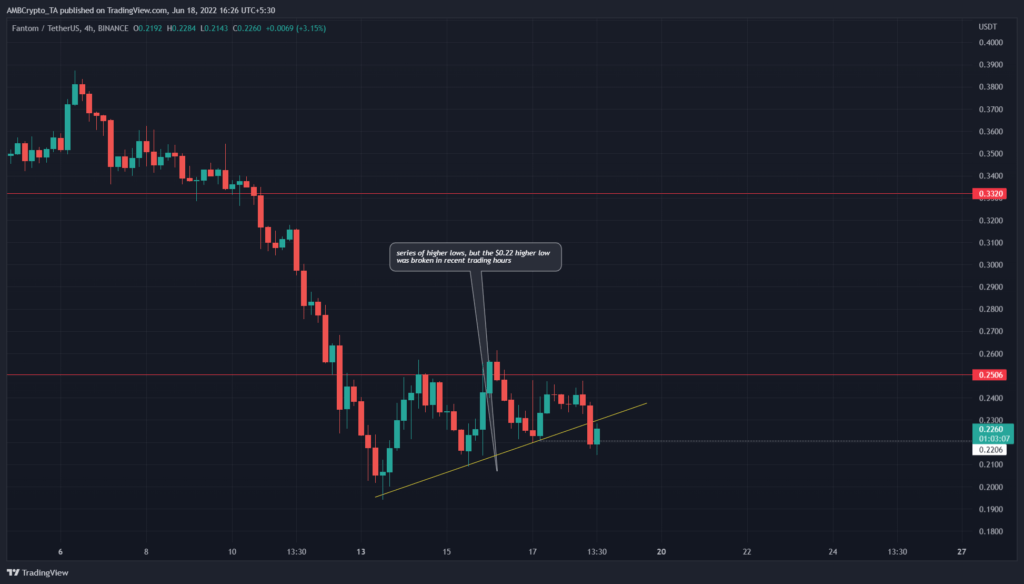
FTM’s H4 chart previously displayed a negative bias, but this was recently reversed. The price ended a session slightly above the lower high that the downtrend made at $0.26.
Fantom also made higher lows at the same period, as shown by the increasing trendline support.
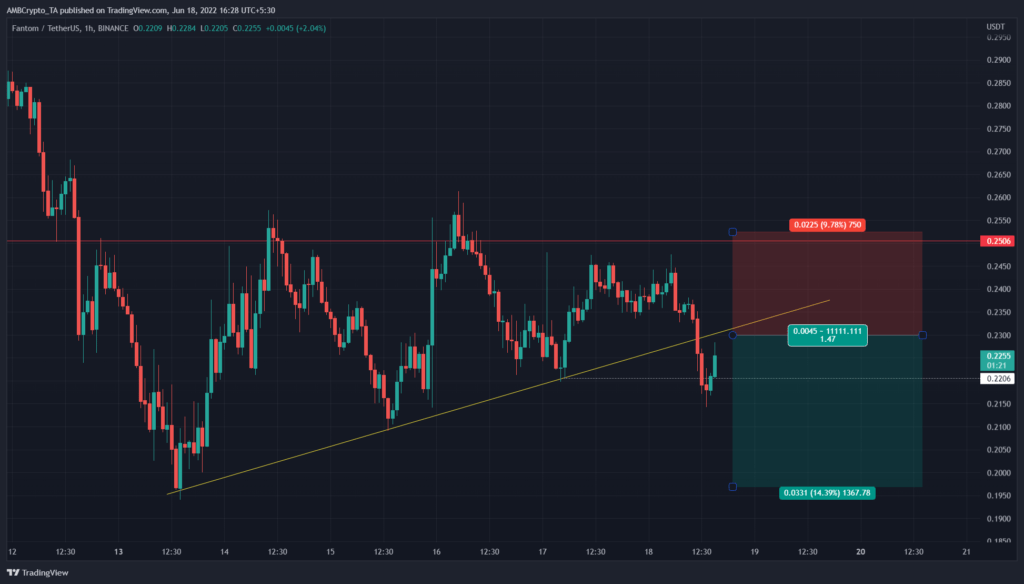
The higher lows that the trendline touches are easier to see on the hourly chart. This trendline’s support has been breached in recent trading hours. A market structure break was seen at the same time since the price fell below the uptrend’s higher low.
As a result, the structure now favoured the bears, however the bias was more nuanced than a basic bearish one due to the move to $0.255.
The trendline support was broken, indicating that a retest of it would present resistance and lead to a move toward the $0.2 lows.
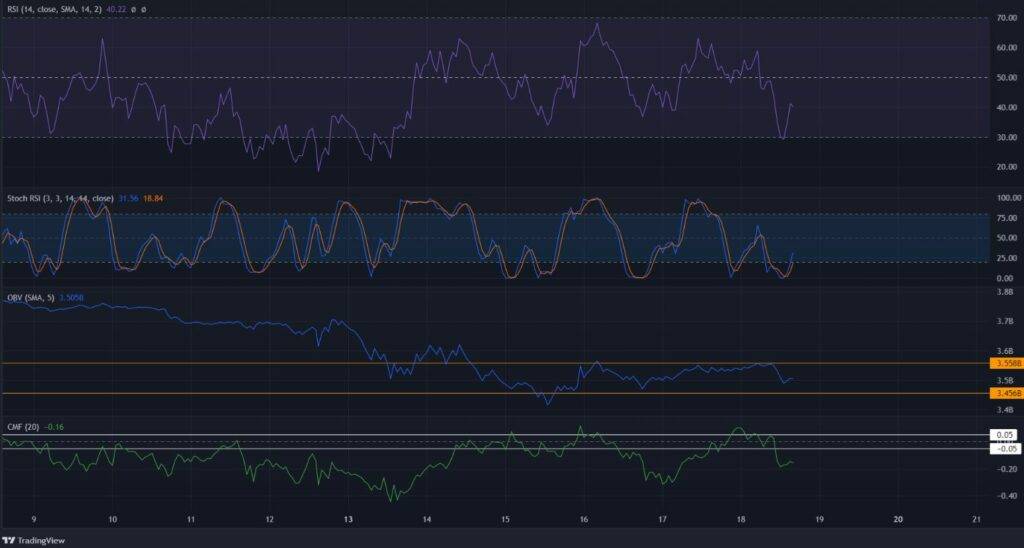
A decrease in the hourly RSI below neutral 50 signals the presence of bearish pressure. Over the past week, it has been unable to rise above the 60 level. This indicated that the purchasers lacked power. In the oversold region, the Stochastic RSI made a positive crossover. This did not necessarily portend a significant increase in Fantom’s price.
The OBV failed to reach the recent highs and indicated that there was no purchasing pressure as well. Additionally, the CMF was below -0.05, indicating a large outflow of capital from the market.
Closing..
The indications on the lower period displayed strong selling pressure and negative momentum. The bullish bias was not very strong on the H4 chart either. In contrast, a bearish tendency was preferred.
The indications on the lower period displayed strong selling pressure and negative momentum. The bullish bias was not very strong on the H4 chart either. In contrast, a bearish tendency was preferred.
Source: AMBcrypto
Get the latest update on the 150+ crypto assets only on BuyUcoin