
The price of Dogecoin has been rising over the past week. Over the past seven days, the coin experienced double-digit gains, rising by almost 20 percent. The $0.07 level has been a point of hard resistance for the meme-coin, and if it trades at or near this price, it may drop to the next support level of $0.05.
Over the past few days, the coin has attempted to gently go upward while the bulls have sought to display indications of recovery. The market value of DOGE has decreased over a shorter period of time. Dogecoin’s value decreased by 4% in the last day.
The coin’s technical outlook has also shown some bullish reversal pattern as it increased by about 20%. Over the past week, buying power has also increased, but since the meme currency showed some bearishness over a shorter time frame, selling are now outnumber buyers.
DOGE has shown a bullish reversal pattern while having negative price movement on the four-hour chart. The market capitalization of all cryptocurrencies as of right now is $979 billion, down 2.9% from the previous day.
Analysis of the Dogecoin Price: One Day Chart
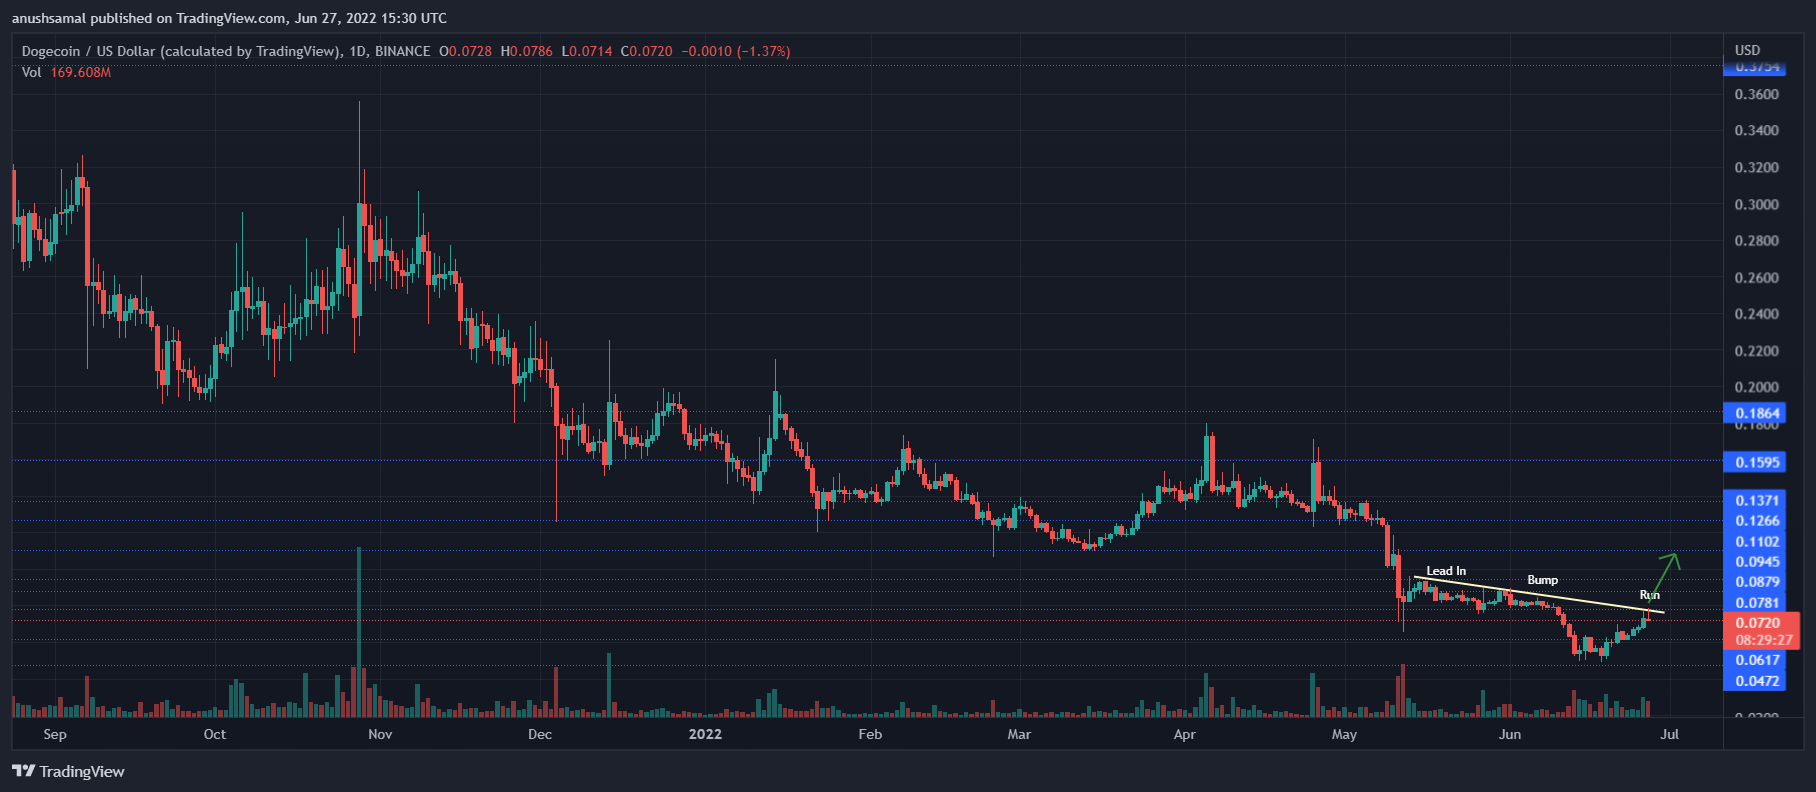
On the one hour price chart, DOGE was trading at $0.072. For a few weeks now, the coin has been unable to move past the same resistance level. Dogecoin’s price will drop from its current level to $0.060 if it fails to hold there, failing to which the coin can try to trade at $0.047.
The coin encountered overhead resistance at $0.08 and then $0.09. The currency has produced a bullish reversal pattern on a longer time scale.
The BARR Bottom pattern is the name of the design. A bump-and-run reversal bottom pattern is what the BARR Bottom pattern is known as.
In a persistent bear market, this technical pattern corresponds to a prolonged trend reversal. The Lead-In phase, Bump phase, and Run phase are the three stages that make up the pattern.
Dogecoin is currently in a phase called the bump, which will be followed by a phase called the run, which will reverse the adverse price action.
If this occurs, the currency may reach levels of $0.090 and eventually $0.011. The decline in Dogecoin trading volume suggests that the buying power has waned on the chart.
Technical Assessment
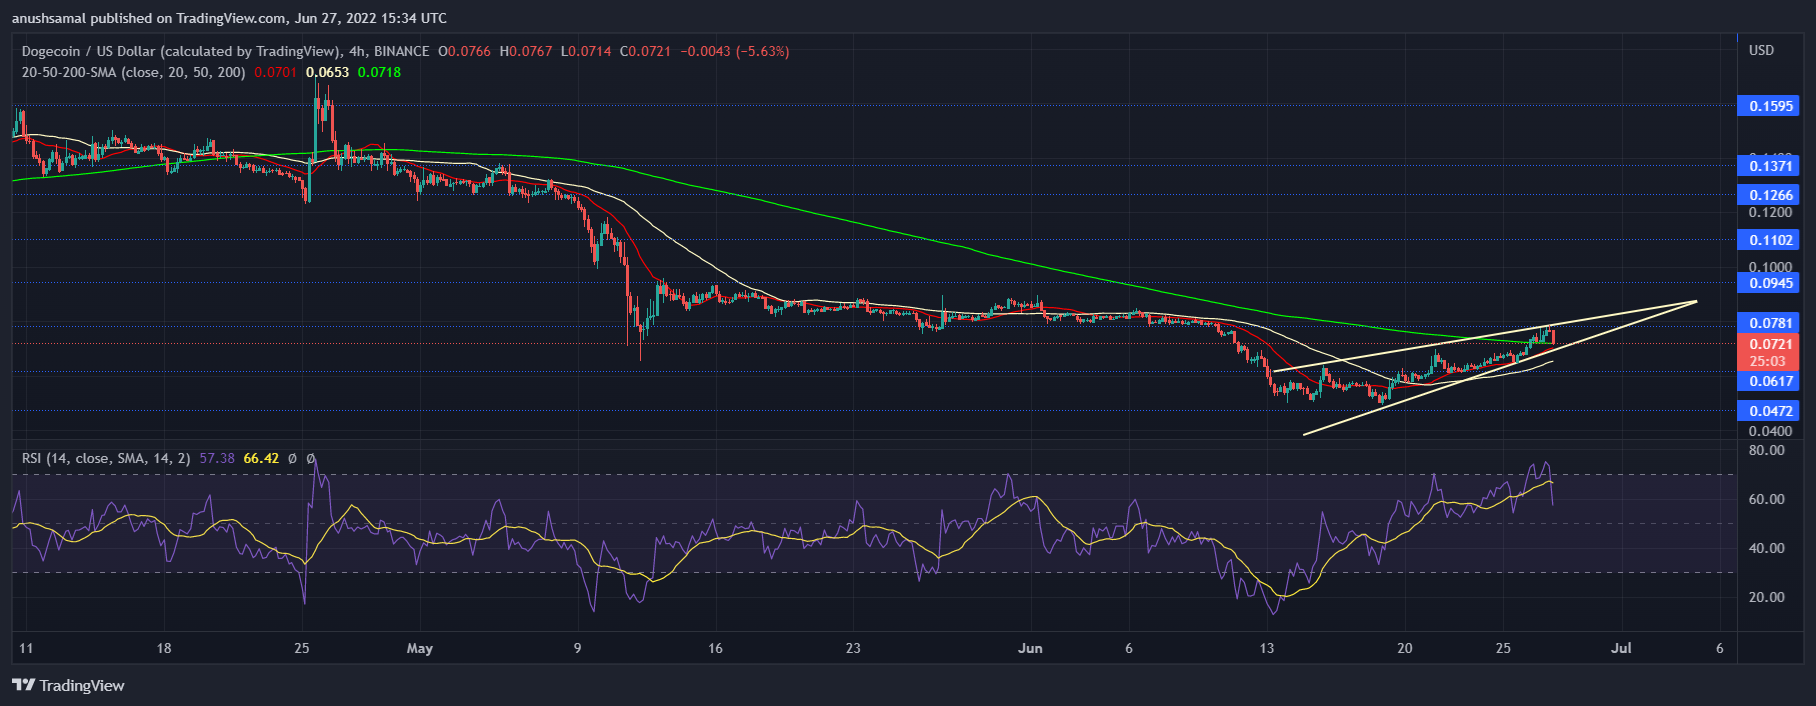
DOGE’s price action was leaning in a bearish direction. On the four hour chart, it even created an ascending wedge formation.
Additionally, the Relative Strength Index showed a decline, indicating that buyers were leaving the market. A negative price indicator is associated with a rising wedge pattern.
It’s probable that DOGE will show some bearishness throughout the upcoming trading sessions. The coin might recover if given more time.
The coin was above the 20-SMA line on the 20-SMA indicator. This demonstrated that purchasers were still driving the price momentum despite declining buying pressure.
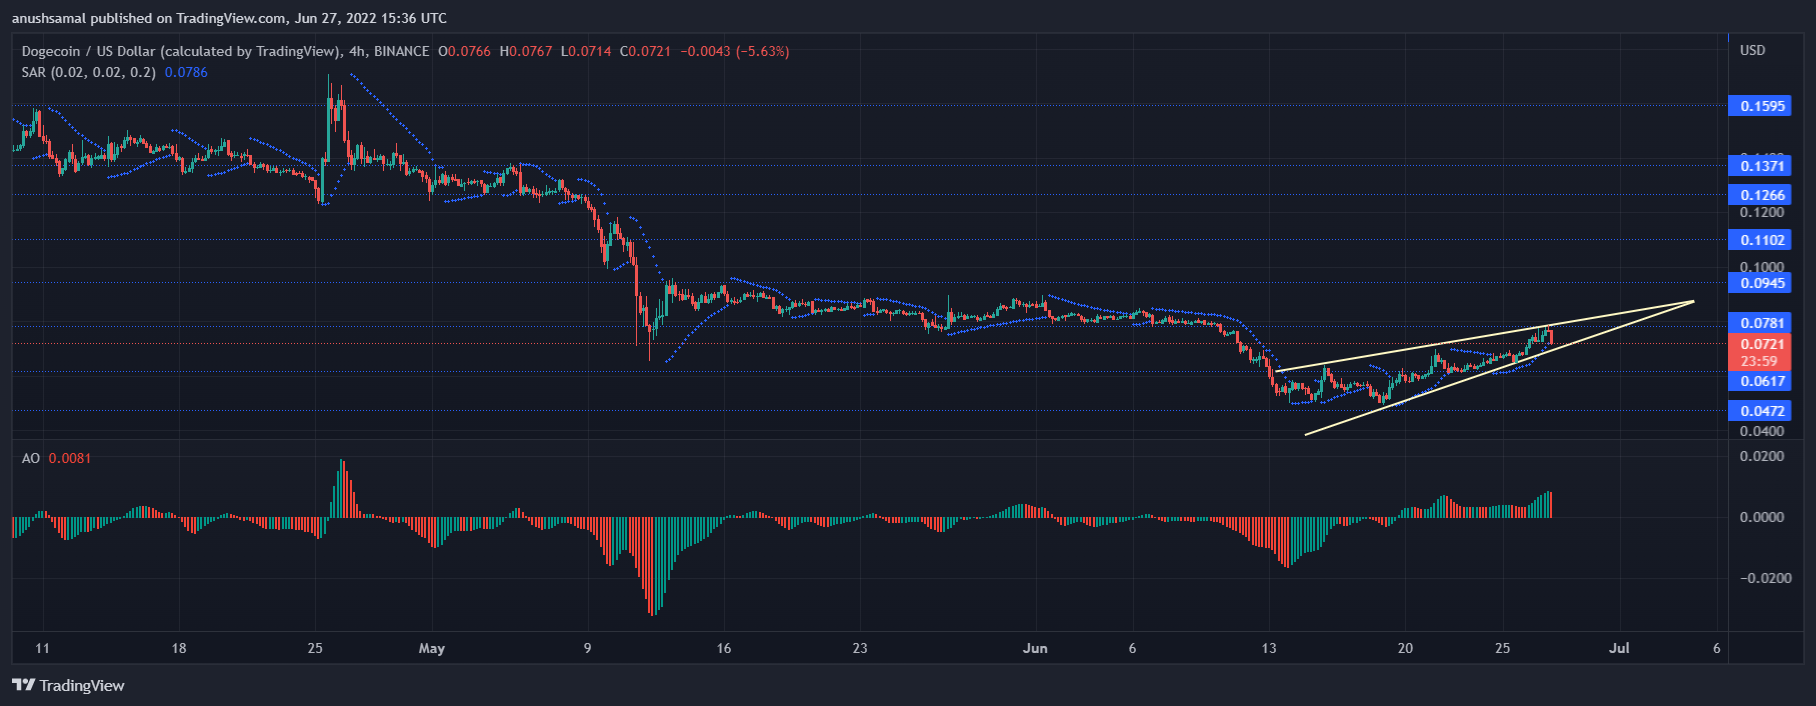
The currency generated a sell signal in line with the technical perspective on the four-hour chart. The price momentum is shown by the Awesome Oscillator, which painted a red signal bar.
The chart’s sell signal is connected to the red signal bar. The present trend as well as trend reversals are both indicated by the parabolic SAR.
On the chart, dotted lines beneath the candlesticks indicate bearishness. It’s possible that the coin will decline throughout the upcoming trading sessions before rising.
Source: Newsbtc